What Is SIPOC? Using the Diagram And Model Explained

A SIPOC diagram is a versatile tool that several stakeholders use within an organization to document its suppliers, input, processes, outputs, and customers. This is where it gets the acronym "SIPOC." With SIPOC diagrams, companies, especially those involved in process improvement, quality management, and project management industries, get to enhance or understand procedures that affect the customer experience by visualizing how each person in the process receives materials or data from the others.
This article aims to explain the SIPOC diagram, including how you can create one for your business, the right scenarios to use a SIPOC diagram and the industries that benefit the most from it.
Table of content
Definition of SIPOC
What is SIPOC diagram?
How to Create a SIPOC Diagram
When to Use a SIPOC Diagram
Industries that use SIPOC
Difference Between Sipoc Diagram and Process Map
What is SIPOC?
The term SIPOC is an acronym for Suppliers, Inputs, Process, Outputs and Customers. SIPOC is a technique for accurately describing the transformation process within a firm that provides goods and services. It is a visual tool for process improvement that summarises the inputs and outputs of a single or several processes in tables. The method of applying this paradigm is also known as process mapping. A so-called high-level process map is the final deliverable.
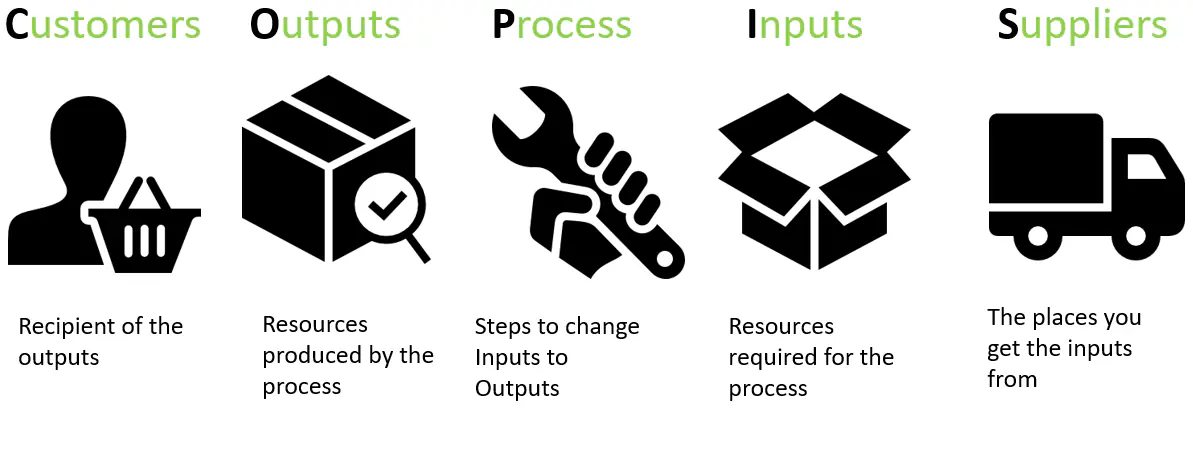
Below are the components of the acronym:
Suppliers
This refers to the providers of process inputs that directly impact outputs. They may be organization members or external parties. For instance, in a SIPOC diagram for modernizing a production line, the suppliers may include a maintenance team, line operators, and contractors. All of these factors affect the output of the process, which is the implementation of a new manufacturing line.
Inputs
This term is for resources, materials, equipment, or data necessary to complete a process and generate outputs. Suppliers furnish these entities. It is crucial to record the most critical inputs. These may involve the creation of electrical designs and drawings, preparing electrical installation and wiring, etc., as part of an engineering process.
Process
This comprises steps that make up a procedure. It links the process's inputs and outputs. It consists of four to five high-level phases.
For example, post-upgrading of the equipment, defining benchmark requirements for the new line, and testing are procedures that may be taken while upgrading a production line.
Outputs
The primary products or services generated by a process. Inputs and outputs might be any resource or action that has been accomplished. Customer-required value is reflected in the deliverables' neutrality and breadth.
For example, an engineering method would generate various reports, including safety reports, test operation reports, and energy savings reports.
Customer
This refers to anyone who benefits from the outputs of the process. Customers and suppliers can both be internal or external to an organization. For example, an engineering process's results recipients are the maintenance team, partners, end clients, and line operators.
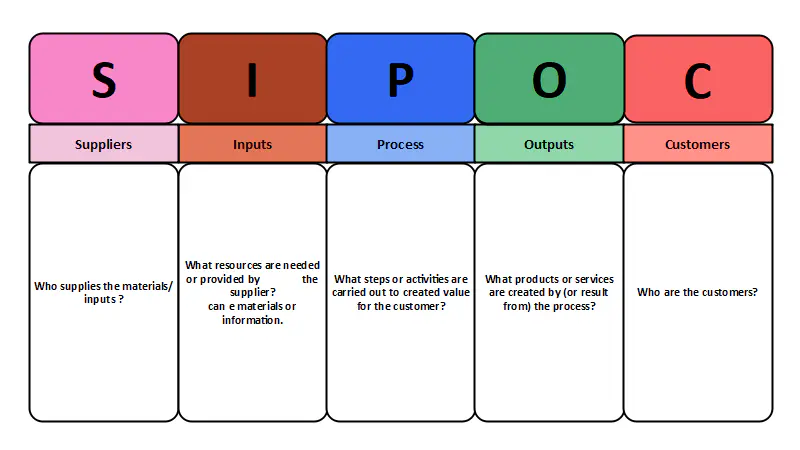
What Is a SIPOC Diagram?
A SIPOC diagram is a table-based visual representation of business operations or a business process map. It serves as a valuable tool in process improvement and quality management by capturing businesses' key elements and their relationships. The diagram begins with the identification of suppliers, representing external entities providing inputs to the process. Inputs are the materials, information, or resources received from suppliers, leading to the core element – the process itself. The process component details the steps and activities undertaken to transform inputs into outputs. Outputs represent the end results or deliverables produced by the process. Lastly, the diagram concludes with the identification of customers, representing both internal and external recipients of the outputs.
There are several ways a process can be defined, from its inception through its completion. For Instance, some firms prefer to use SIPOC while some firms employ the reverse term 'COPIS' (Customers, Outputs, Process, Inputs, Suppliers), which places customer requirements first and demonstrates the customer's worth to the organization.
In the COPIS model, the focus begins with understanding and prioritizing customer needs, underscoring the importance of customer value to the organization. This customer-centric perspective guides the analysis and optimization of processes, aligning them more closely with customer expectations and enhancing overall organizational effectiveness.
In reality, SIPOC is a process mapping and augmentation method that uses a SIPOC diagram to describe the inputs and outputs of one or more processes.
Using the SIPOC tool ensures that everyone involved in a project or process is on the same page, from new hires to stakeholders.
As a result, that which is at risk can be seen from all sides. Furthermore, an increase in transparency aids in identifying wasteful activities and laying the groundwork for future problem-solving.
Even though it aids organizational alignment, the SIPOC method is a straightforward but overly simplified approach to process mapping and can be used in conjunction with other strategies.
In the realm of process improvement and quality management, the SIPOC (Supplier, Input, Process, Output, Customer) diagram serves as a valuable tool for visualizing and understanding the key elements of a process. It provides a structured framework that aids in defining, analyzing, and improving processes within an organization. In this article, we'll delve into SIPOC examples across various industries to showcase its versatility and effectiveness.
How to Create a SIPOC Diagram
Let's start by briefly reviewing the components of a SIPOC diagram before discussing how we can create one with examples:
Supplier: Entities or individuals providing inputs to the process.
Input: Raw materials, information, or resources entering the process.
Process: The series of steps or activities that transform inputs into outputs.
Output: The end result or product produced by the process.
Customer: Individuals or entities receiving the outputs of the process.
Now that you understand the basics, let's walk you through the steps of creating a SIPOC diagram for your organization.
1. Choose Your Process:
The first step is to identify the specific process you want to analyze. It could be anything from onboarding new customers to designing a product, manufacturing an item, or delivering a service. Choose a process that's important and has room for improvement.
2. Define the Process:
Here, you break down your chosen process into its key steps. Aim for 4-8 high-level steps, each described with an action and a subject. For example, in a customer onboarding process, you might have steps like "Verify identity," "Set up account," "Welcome email," and "Train on software."
3. Identify Outputs:
Think about what tangible or intangible results come out of your process. These are your outputs. They could be finished products, delivered services, completed applications, or generated reports. Be specific and ensure each output directly relates to a process step.
4. Identify Customers:
Who receives or benefits from your outputs? These are your customers. They could be internal stakeholders, external clients, or end users. Clearly define who receives each output, ensuring all are accounted for.
5. List Inputs:
What resources (materials, information, data) are necessary for each process step to produce its output? These are your inputs. Identify suppliers for each input, whether it's internal teams, external vendors, or data sources.
6. Draw the Diagram:
Now, it's time to put it all together! Use a simple table or flowchart format to visually represent your SIPOC. Label the columns or sections with "Supplier," "Input," "Process," "Output," and "Customer." Fill in the information you gathered in steps 2-5, connecting each input to its corresponding process step and output.
7. Analyze and Improve:
Your SIPOC diagram is a snapshot of your process. Analyze it for potential bottlenecks, unnecessary steps, or missing components. Look for ways to optimize inputs, streamline processes, and improve outputs to better meet customer needs.
Here is an example of a SIPOC diagram for a new product introduction:
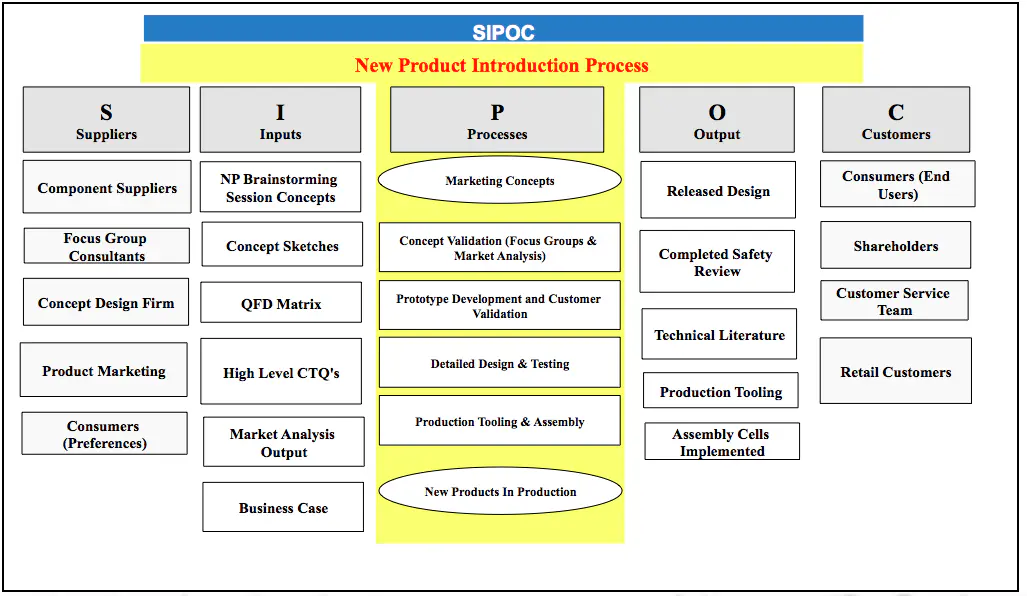
Remember, a well-constructed SIPOC diagram offers a clear, high-level view of a process, fostering understanding and providing a foundation for process improvement efforts.
When to Use a SIPOC Diagram
1. Understanding a New Process:
When you're unfamiliar with a process, creating a SIPOC diagram can quickly reveal its key components, suppliers, and customers, aiding understanding and decision-making.
2. Defining Project Scope:
SIPOC diagrams can clarify project boundaries by defining inputs, outputs, and customers, ensuring everyone involved understands the scope and deliverables.
3. Analyzing Problems or Issues:
SIPOC is ideal if you want to pinpoint where issues arise. This is because by mapping a problematic process with SIPOC, you get to facilitate root cause analysis and targeted problem-solving.
4. Identifying Improvement Opportunities:
Visualizing a process through SIPOC can highlight potential bottlenecks, redundancies, or gaps, pinpointing areas for improvement and optimization.
5 . Onboarding New Employees:
SIPOC diagrams can efficiently introduce new team members to key processes, accelerating their understanding and integration into the workflow.
6. Process Documentation:
SIPOC diagrams serve as concise and visual process documentation, aiding future reference, training, and audits.
7. Managing Change:
SIPOC diagrams can help assess the impact of proposed changes on a process, identifying potential risks and benefits before implementation.
8. Measuring Process Performance:
By visualizing inputs, outputs, and customers, SIPOC diagrams can guide the development of meaningful process performance metrics, enabling effective evaluation and continuous improvement.
Industries That Use SIPOC
The SIPOC diagram is a complete process improvement tool that depicts a process along with its inputs and outputs on a single map accessible to everyone. Consequently, the business mapping concept applies to every industry, organization, and individual.
Here are some industries that can use the SIPOC Model:
1. Construction
2. HR
3. Tech
4. Services
5. Banking
6. Manufacturing
SIPOC Examples
1. Manufacturing Industry:
Automobile Manufacturing Process
Supplier: Steel suppliers, electronics manufacturers, tire manufacturers.
Input: Raw materials (steel, rubber, electronics components), assembly line workers.
Process: Assembly line operations, welding, painting, quality checks.
Output: Fully assembled automobiles.
Customer: Dealerships, end consumers.
In this example, the SIPOC diagram helps visualize the complex supply chain and manufacturing process involved in producing automobiles. It highlights the interconnected nature of various suppliers, inputs, and the intricate assembly process.
2. Healthcare Industry:
Example: Patient Admission Process in a Hospital
Supplier: Patients, medical staff, administrative staff.
Input: Patient information, medical history, insurance details.
Process: Registration, medical examination, insurance verification, admission.
Output: Admitted patients with proper documentation.
Customer: Medical staff, patients, insurance companies.
In healthcare, the SIPOC diagram proves valuable in illustrating the steps involved in admitting a patient to a hospital. It emphasizes the importance of accurate information flow between the patient, medical staff, and administrative personnel.
3. Service Industry:
Customer Support Process in a Call Center
Supplier: Customers, call center agents, management.
Input: Customer inquiries, support tickets, agent training.
Process: Call handling, issue resolution, escalation procedures.
Output: Satisfied customers, resolved issues, feedback data.
Customer: End-users, customer support management.
In the service industry, particularly in customer support, the SIPOC diagram aids in mapping out the workflow of addressing customer inquiries. It highlights the critical role of call center agents and the importance of efficient issue resolution.
4. Retail Industry:
Example: Inventory Management Process in a Retail Store
Supplier: Suppliers of goods, logistics providers, store staff.
Input: Inventory data, sales data, supplier information.
Process: Ordering, receiving, stocking, sales tracking.
Output: Well-managed inventory, optimized stock levels.
Customer: Retail customers, store management.
In retail, managing inventory is a critical process. The SIPOC diagram showcases the interactions between suppliers, store staff, and the processes involved in maintaining optimal stock levels to meet customer demand.
5. IT Industry:
Example: Software Development Process
Supplier: Project stakeholders, development team members, external vendors.
Input: Project requirements, design specifications, coding standards.
Process: Requirement analysis, design, coding, testing, deployment.
Output: Developed software, documentation, user manuals.
Customer: End-users, project stakeholders.
In the IT industry, the SIPOC diagram proves beneficial in illustrating the software development lifecycle. It emphasizes the collaborative efforts of various stakeholders and the iterative nature of the development process.
6. Education Sector:
Example: Student Enrollment Process in a University
Supplier: Prospective students, academic staff, admissions office.
Input: Student applications, academic transcripts, admission policies.
Process: Application review, interviews, document verification, enrollment.
Output: Enrolled students, student records.
Customer: Students, academic staff, administrative personnel.
In the education sector, the SIPOC diagram aids in visualizing the steps involved in student enrollment. It emphasizes the interactions between prospective students, academic staff, and the administrative processes ensuring accurate record-keeping.
7. Construction Industry:
Example: Construction Project Planning Process
Supplier: Construction materials suppliers, architects, project managers.
Input: Project requirements, architectural plans, budget.
Process: Planning, design review, material procurement, construction.
Output: Completed construction project, documentation.
Customer: Project owners, regulatory authorities, end-users.
In construction, the SIPOC diagram showcases the collaboration between various suppliers, architects, and the steps involved in the project planning and execution process.
Difference Between Sipoc Diagram and Process Map
Business process mapping is an organized approach to documenting what a firm process is, who is accountable for its completion, what its inputs and outputs are, and what constitutes a successful business.
On the other hand, value stream mapping is a Lean management technique that illustrates all the essential steps of a delivery process, visualizes work items, and facilitates conventional status reporting.
While the ultimate objective of a business process map is to help firms design more effective strategies, value stream mapping emphasizes the value created by each process stage. In addition, VSM pushes process modifications, whereas business process mapping aims to make existing processes more efficient.
Conclusion:
The SIPOC diagram, with its clear and structured representation of processes, proves to be a versatile tool applicable across diverse industries. Whether in manufacturing, healthcare, services, retail, IT, education, or construction, the SIPOC diagram provides a comprehensive view of the supply chain and operational processes.
By utilizing SIPOC diagrams, organizations can gain valuable insights into their processes, identify areas for improvement, and enhance overall efficiency. It serves as a visual guide that promotes a shared understanding among stakeholders, making it an indispensable asset in the toolkit of process improvement and quality management.
Keep Reading
Related Articles

Mar 27, 2024 · 7 min read
How to Keep Your Remote Agile Team Engaged?
In a remote setting, agile principles empower your team to deliver value, enhance processes, and self-organize while maintaining a healthy work environment.

Nov 28, 2023 · 8 min read
What is Design Thinking And Why is it Important?
Design thinking is based on the idea that the best solutions are made by understanding the user's wants and then iterating on ideas until a solution is found that is both effective and desirable.

May 05, 2026 · 15 min read
Top 6 SDLC Methodologies Explained
Waterfall Methodology Agile Methodology DevOps Lean Methodology Iterative Methodology Spiral Methodology